What is GIS and why is it important?
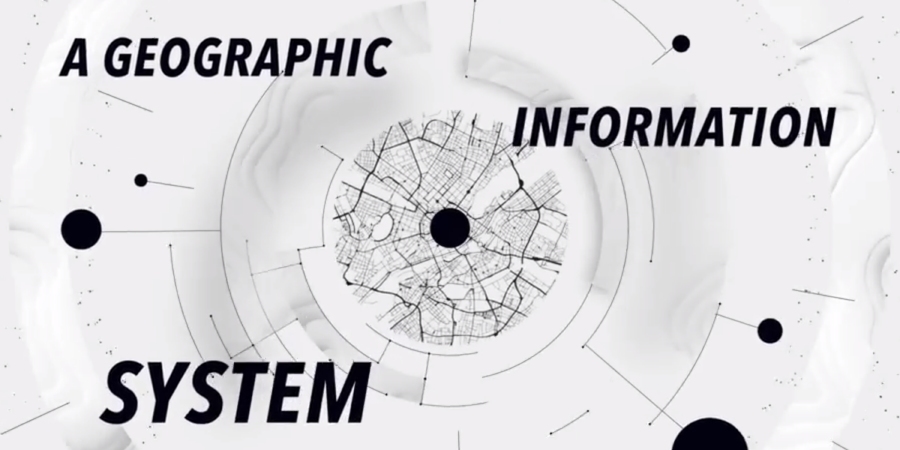
Imagine a map that not only shows streets and buildings, but also information about how many people live in a neighbourhood, where trees are located, how high the groundwater is, or where the nearest bike paths run. A Geographic Information System (GIS) connects such maps with a large amount of data. It helps link places to facts and make visible how things are spatially related. This is very practical for urban planning because cities are complex spaces, and good decisions depend on understanding the area well 1Gisnavigator, “The Role of GIS in Urban Planning”, gisnavigator, accessed January 23, 2026, www.gisnavigator.co.uk.
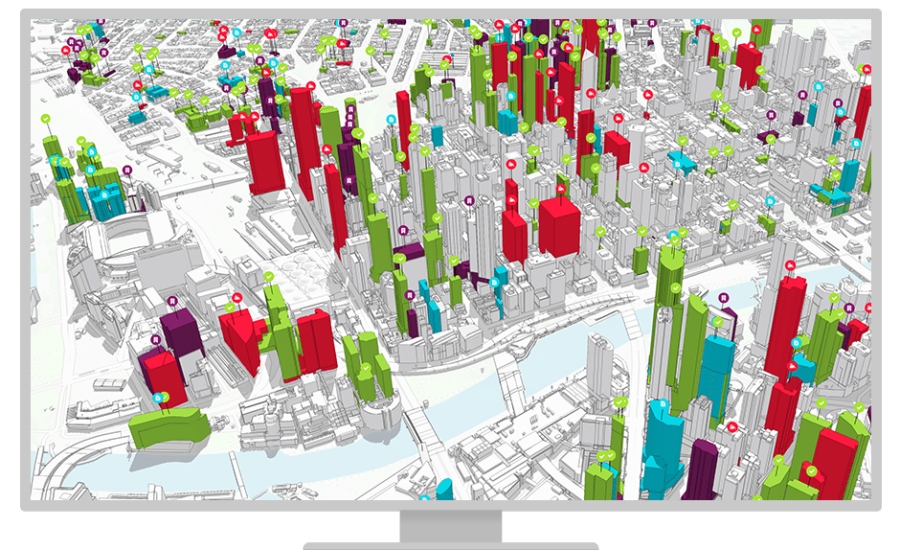
FIG. geomarvel.com/smart-city-planning-with-arcgis-urban/
Geoinformation systems are a key tool for implementing international sustainability and climate protection goals, as set out in the 2030 Agenda for Sustainable Development and in the Paris Climate Agreement. By collecting, analysing, and visualising environmental and climate-specific data, such as greenhouse gas emissions, flood risk areas, energy infrastructures, or particularly vulnerable population groups, GIS enable well-informed decision-making in politics, administration, and spatial planning 2Bundesministerium für Umwelt, Naturschutz, nukleare Sicherheit und Verbraucherschutz (BMUV): “Die 2030-Agenda für Nachhaltige Entwicklung”, BMUV, accessed January 23, 2026, https://www.bundesumweltministerium.de/themen/nachhaltigkeit/2030-agenda. Especially at the municipal and regional levels, GIS make an important contribution to sustainable urban and spatial development. They reveal spatial relationships between settlement development, infrastructure provision, and climate risks, thereby supporting integrated planning. In this way, GIS contribute to the implementation of the United Nations’ Sustainable Development Goal 11, which aims for sustainable, resilient, and liveable cities and communities. Furthermore, geographic information systems play a significant role in implementing climate policy measures. They enable the identification of spatial emission hotspots, support site planning for renewable energies, and assist in the development and prioritisation of climate adaptation measures. This allows national and regional climate protection and adaptation strategies to be implemented more specifically and effectively. Overall, GIS act as a connecting element between spatial conditions, societal needs, and political objectives. They help translate global climate and sustainability goals to the local level and convert them into concrete, spatially differentiated, and measurable measures in spatial planning and climate adaptation 3Bundesinstitut für BauStadt- und Raumforschung, “Klimawandelgerechte Stadtentwicklung – Ursachen und Folgen des Klimawandels durch urbane Konzepte begegnen”, Bundesinstitut für BauStadt und Raumforschung, accessed January 23, 2026, https://www.bbsr.bund.de/BBSR/DE/forschung/programme/exwost/Studien/2009/KlimaStadtentwicklung/02_Konzept.html.
“What is GIS?” explained in a video on www.esri.com
Who in a city administration uses GIS — and how is the work organised?
Various departments in a city administration work with GIS: the building authority, surveying office, green space office, traffic office, disaster control office, and often also the IT or GIS centre of the city. Some cities have a central geo or surveying office that collects geodata, maintains it, and distributes it to other departments. Other tasks are managed in a decentralised way, but the data are combined in shared GIS systems. Administrative GIS are often connected with specialised systems (e.g., for waste management, street maintenance, or building management) so that everyone works with the same maps and datasets 4UN-HABITAT, „Urban Planning,“ UN-HABITAT, accessed January 23, 2026, https://unhabitat.org/topic/urban-planning.
An important process also exists: first, data are collected and verified, then spatial analyses are conducted (e.g., determining where new housing can be built), results are visualised (maps, diagrams), and finally planning measures are implemented. In larger projects, there are meetings in which maps serve as a common basis, this makes discussions much more concrete 5Landesamt für Digitalisierung, Breitband und Vermessung, „Bayerische Vermessungsverwaltung,“ LDBV, accessed January 23, 2026, https://www.ldbv.bayern.de/vermessung/bvv/.
How do city administrations generate geodata?
City administrations use several methods to generate reliable geodata:
- Ground surveying (GNSS, total stations)
Traditional measuring devices (GNSS, total stations) provide very accurate points, e.g., for cadastral boundaries, building corners, or road axes. These measurements are important when centimetre-level accuracy is required. - Aerial imagery and photogrammetry
Airplanes or drones photograph an area. From overlapping images, 3D models and maps can be created (photogrammetry). This is useful for large-scale, detailed depictions of city districts. - LiDAR (laser scanning)
LiDAR scanners (on aircraft, drones, or on the ground) measure millions of points and generate point clouds. From these, precise terrain models, building height profiles, or tree canopy models can be created, very useful for flood or visibility analyses. - Remote sensing / satellite data
Satellites provide regular images that are suitable for analysing large-scale changes (e.g., vegetation development, expansion of settlements). - Official registers and existing datasets
Cadastral data (parcels), address registers, road data, utility plans (water, sewer, gas) often come from internal specialised systems and form the basis of many analyses. - Crowdsourcing and open-source data (e.g., OpenStreetMap)
For some tasks, administrations also use volunteer data (e.g., from OpenStreetMap) or citizen participation tools, especially when rapid updates or local information are needed. - Open data portals
Many countries and cities provide geodata publicly (Open Data). In Germany, there are national and regional geoportals through which authorities, planners, and the public can download data 6Maptionnaire, “Stop Guessing. Start Community Mapping.”, Maptionnaire, accessed January 22, 2026, https://www.maptionnaire.com/.
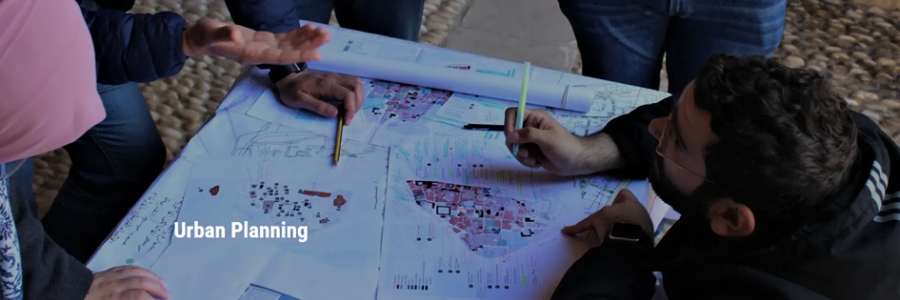
FIG. unhabitat.org/topic/urban-planning
What do city administrations use GIS for? (Concrete application examples)
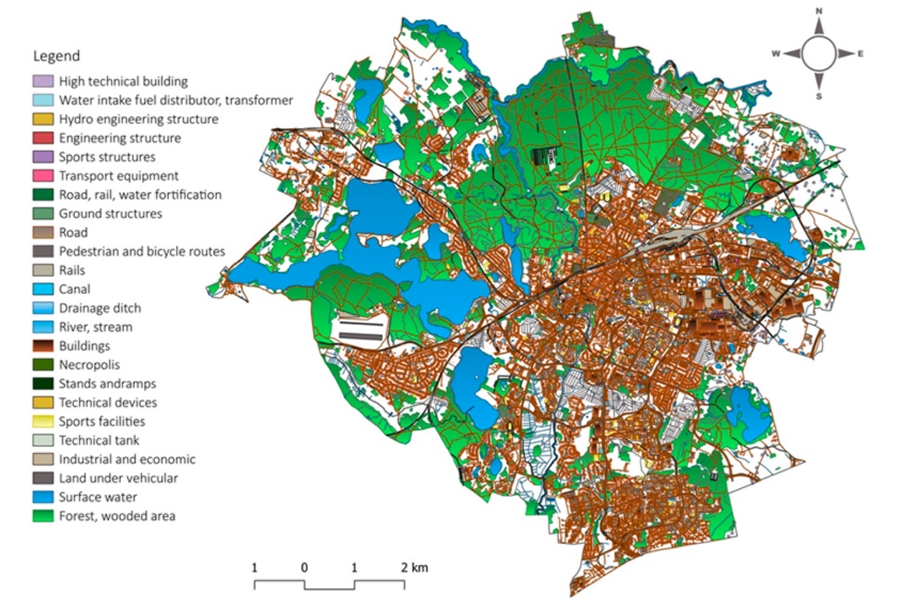
FIG. www.mdpi.com/2071-1050/16/12/5187
GIS is used very diversely in cities. Here are central examples, with brief explanations of what is possible in each case:
- Land-use and zoning planning
GIS shows where which uses (residential, commercial, green spaces) are possible. For example, it can check which areas are still suitable for new housing without encroaching on nature reserves.
- Infrastructure and asset management
Streets, sewer systems, lighting, trees: all can be stored as objects with attributes (age, condition, last maintenance) in GIS. This allows maintenance, repairs, and investments to be planned more efficiently.
- Traffic planning and mobility
GIS analyses traffic counts, accident frequencies, or pedestrian networks. From this, better bike paths, stops, or traffic light control can be planned.
- Environmental and climate adaptation (e.g., floods)
GIS helps map flood-prone areas, calculate runoff paths, and plan protective measures (green areas, retention basins). These analyses are especially important because extreme weather events are increasing.
- Urban greenery and biodiversity
Maps of tree locations, biotopes, or green spaces help improve the ecological quality of the city and reduce urban heat islands.
- Emergency and disaster management
In a crisis (e.g., flood, large fire), GIS maps show evacuation routes, endangered areas, and available resources, very useful for quick decisions.
- Citizen participation and public relations
Interactive maps on the internet or apps allow citizens to report problems (e.g., broken streetlights) or place suggestions on a map. This makes planning more transparent and closer to the people 7MDPI, “Land”, MDPI, accessed January 21, 2026, https://www.mdpi.com/journal/land.
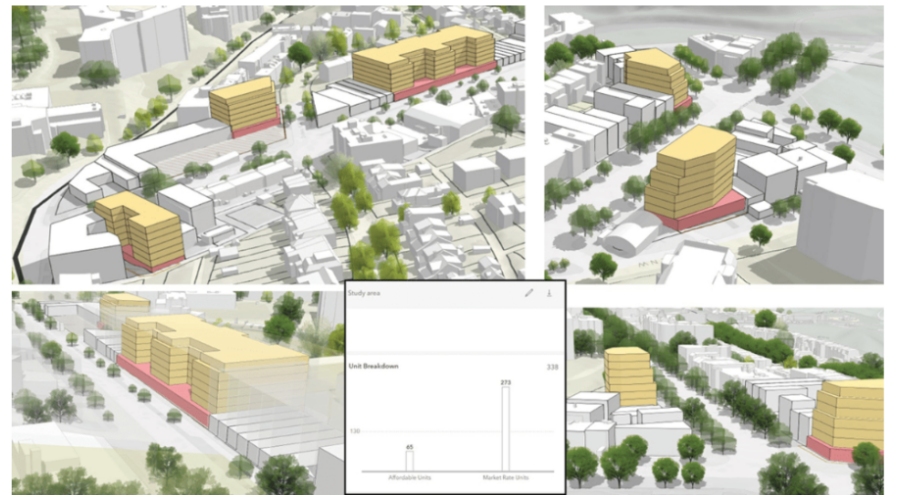
FIG. www.esri.com/en-us/industries/blog/articles/role-of-gis-in-planning-in-2025
How do concrete planning results emerge? A simple example
Suppose the city wants to plan a new park:
- Data collection: locations of parcels, ownership, elevation model, existing paths, tree locations, surface coverage.
- Analysis: GIS checks flood risks, calculates sightlines, examines walkability for residents, and verifies if underground utilities interfere.
- Visualisation: Several alternatives are presented as maps and 3D models so that politics and the public can understand the proposals 8Bundesamt für Kartographie und Geodäsie, „Kartographie,“ BKG, accessed January 22, 2026, https://www.bkg.bund.de/DE/Home/home.html.
- Decision and implementation: After selecting a variant, GIS data support tenders, construction monitoring, and later maintenance measures.
Legal aspects, data protection, and open standards
Geodata are subject to rules in many countries, such as regulations on data quality and openness (INSPIRE directive in the EU, national geoportals). Many administrations provide data as Open Data so that planning is more transparent and startups or schools can also use the data. At the same time, personal information (e.g., addresses linked to sensitive data) must be protected.
Opportunities and limitations of GIS in urban planning
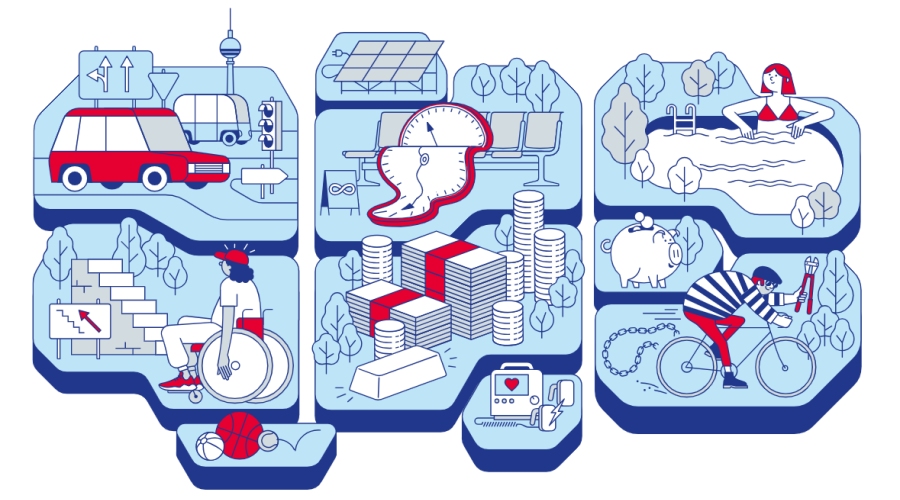
FIG. odis-berlin.de
Opportunities:
GIS makes complex relationships visible, improves collaboration within administrations, increases transparency to the public, and enables data-based decisions. It also helps with climate adaptation, traffic management, and efficient resource use.
Limitations:
Data must be current and accurate, otherwise, wrong maps can lead to poor decisions. Generating highly precise data (e.g., LiDAR) can be expensive. Trained personnel are needed to interpret analyses correctly. Open data must also be handled carefully with respect to privacy 9ESRI, “The Role of GIS in Planning in 2025”, ESRI, accessed January 21, 2026, https://www.esri.com/en-us/industries/blog/articles/role-of-gis-in-planning-in-2025.
Conclusion — What does this mean for students?
GIS is an invisible but very powerful foundation of modern urban planning. If you live or work in a city, GIS-based decisions can affect the quality of your life, from air and greenery to bike paths and flood protection. GIS data also provide many opportunities for school projects (e.g., mapping projects, environmental analyses, or participatory formats) because many cities and countries make their data openly available.
Esri GIS School Program Europe
Esri GIS School Program Europe is an educational initiative by Esri Europe that provides schools with free access to professional GIS software (ArcGIS Online) as well as teaching materials, training, and projects for digital mapping. Its goal is to teach students GIS skills and promote spatial thinking 10ESRI, “Esri GIS School Program Europe”, ESRI, accessed January 21, 2006, https://www.esri.com/en-us/school-program-europe/overview.
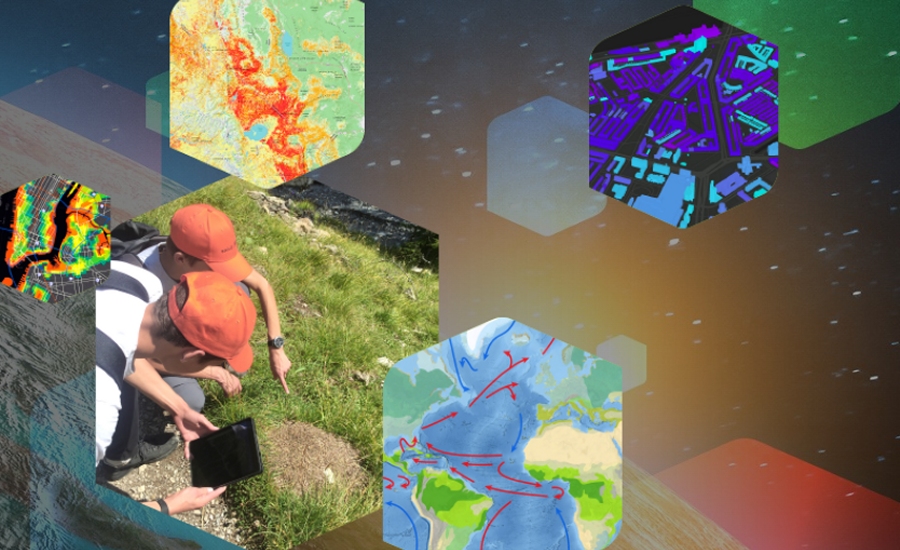
FIG. www.esri.de/de-de/schulprogramm/uebersicht
Bibliography
- Bundesamt für Kartographie und Geodäsie, “Kartographie”, BKG, accessed January 22, 2026, https://www.bkg.bund.de/DE/Home/home.html
- Bundesinstitut für Bau-, Stadt- und Raumforschung, “Klimawandelgerechte Stadtentwicklung – Ursachen und Folgen des Klimawandels durch urbane Konzepte begegnen”, Bundesinstitut für Bau-, Stadt- und Raumforschung, accessed January 23, 2026, https://www.bbsr.bund.de/BBSR/DE/forschung/programme/exwost/Studien/2009/KlimaStadtentwicklung/02_Konzept.html
- Bundesministerium für Umwelt, Naturschutz, nukleare Sicherheit und Verbraucherschutz (BMUV): “Die 2030-Agenda für Nachhaltige Entwicklung”, BMUV, accessed January 23, 2026, https://www.bundesumweltministerium.de/themen/nachhaltigkeit/2030-agenda
- ESRI, “Esri GIS School Program Europe”, ESRI, accessed January 21, 2006, https://www.esri.com/en-us/school-program-europe/overview
- ESRI, “The Role of GIS in Planning in 2025”, ESRI, accessed January 21, 2026, https://www.esri.com/en-us/industries/blog/articles/role-of-gis-in-planning-in-2025
- Gisnavigator, “The Role of GIS in Urban Planning”, gisnavigator, accessed January 23, 2026, gisnavigator.co.uk
- Landesamt für Digitalisierung, Breitband und Vermessung, “Bayerische Vermessungsverwaltung”, LDBV, accessed January 23, 2026, https://www.ldbv.bayern.de/vermessung/bvv/
- Maptionnaire, “Stop Guessing. Start Community Mapping.”, Maptionnaire, accessed January 22, 2026, https://www.maptionnaire.com/
- MDPI, “Land”, MDPI, accessed January 21, 2026, https://www.mdpi.com/journal/land
- UN-HABITAT, „Urban Planning,“ UN-HABITAT, accessed January 23, 2026, https://unhabitat.org/topic/urban-planning